Nutrient performance indicators for the Australian grains industry
This project aims to develop and test a process to measure and report the nutrient use benchmarks partial nutrient balance (PNB) and partial factor productivity (PFP) for N, P, K and S for grain production systems against which growers can assess their nutrient management practices. These metrics will be derived at national, agroecological zone, regional and farm levels using published and surveyed information.
IPNI-2015-AUS-023
Nutrient efficiency and grain production
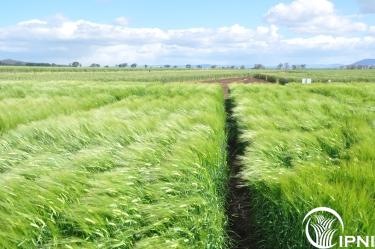 Barley trial plots
Nutrient performance indicators from southern Australian grain farms.
Field records of fertiliser use and crop type and yield were collected from 514 fields from 125 growers covering over 35,000 ha over 4 or 5 years in south-eastern Australia. The data came from either consultants or directly from farmers and the cohorts from the Mallee, High Rainfall Zone, the Wimmera and southern New South Wales were considered adequate to interrogate for nutrient performance indicators.
The frequency distribution of PNB and PFP were skewed to the right, with the mean larger than the median, so that comparing mean regional values is not statistically valid. Because of this, data may be best presented as distributions (Figure 1).
The data from the 500 fields reported showed N-PNB was generally higher than 1.0, while P-PNB is generally lower than 1.0. The N-PNB is higher than 1.0 for over half the fields assessed in all regions except the Mallee where 39% were above 1.0. The P-PNB value reported in this study is lower than data from other countries and this is likely a consequence of the P-sorbing soils fixing some of the applied P.
The P-PFP values collected from the farms surveyed are generally around 200 kg grain/kg P. The N-PFP values show wide variations due to rotation and soil N status and the around half the values from the farmers’ fields are less than 50 kg grain/kg N suggesting that those low values may be limited by some biotic or abiotic constraints other than nutrients. It is debatable if the high values indicate that N supply is limiting production but rather that extra N is being drawn from soil reserves, either from new or old organic N sources.
Despite the limitations of PNB, PFP and NBI, if growers can develop these nutrient performance indicators for their fields or farms, it will allow them to index the performance against others. The PNB will advise whether nutrients are being added or removed from the field, the NBI indicates the magnitude of that change and the PFP indicates the sort of return achieved for the nutrients supplied. These metrics are indicators and are not efficiency measures or environmental loss assessments and so should be the start of the process of investigating opportunities for improving nutrient performance. They need to be aligned with other indicators such as soil nutrient levels or other soil health measurements.
Figure 1. Cumulative distributions of nitrogen and phosphorus nutrient performance indicators for south-eastern Australian cropping systems, a) Partial factor productivity and b) Partial nutrient balance.
Additional Resources
Report of a nutrient use efficiency survey of 500 grain farmsSize: 6.43 MB