09 Oct 2012
Maize Response to Balanced Fertilizer Application in Northwest China

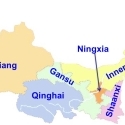
Spring maize is one of the main crops in China’s Northwest region comprising of Gansu, Inner Mongolia, Xinjiang, and Ningxia provinces. In 2010, the total maize production in the region was nearly 30 million (M) t from an area of 5.4 M ha (MOA, 2010), with an average yield of 5,538 kg/ha. For years, fertilizer use in Northwest China has been inadequate mainly because of economic constraints. Therefore, little information is available on nutrient limiting factors and the economic value of balanced fertilizer application to the maize crop in the region.
Materials and Methods
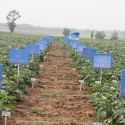
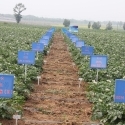
Since 2003, IPNI’s China program conducted a series of field experiments in collaboration with the provincial soil and fertilizer institutes to evaluate the responses of spring maize to N, P, and K fertilizer applications. A total of 16 field trials were conducted - 6 in Gansu province, 4 in Xinjiang, 4 in Inner Mongolia, and 2 in Ningxia. Table 1 shows some chemical properties of soils at these sites before the field trials began. All trials had four treatments, viz., optimum (OPT) NPK treatment recommended by Agro Services International (ASI) soil testing and fertilizer recommendation procedure (Portch and Hunter, 2005) based on target yields in the different locations, and three nutrient omission plots (OPT-N, OPT-P and OPT-K.) All experiments were set up in a randomized complete block design with three replications. Economic comparisons were made between OPT and farmer practice (FP) at some sites in Gansu and Xinjiang provinces.
Results and Discussion
Maize yields varied greatly for different years and sites (Figure 1). Nitrogen was the main limiting nutrient for the maize crop giving significant responses in 12 of the 16 sites/years, with 6% to 607% yield increase with N application (Table 2). Although the available P in most soils was more than 10 mg/L, a deficient level for the soil testing system used here, application of P fertilizer still significantly (P<0.05) increased maize yields at 9 of the 16 sites by -4% to 36%. This response to P reflects the high rates of N being applied. Similarly, K application increased maize yields at 7 of the 16 sites by 2% to 54%. Interestingly, however, no significant relationship existed between the relative yield of maize in -P and -K plots and soil test values of P and K. This might be due to the impact of other factors such as high levels of soil P and climatic conditions (Figure 2).
The agronomic efficiencies of N (AEN), P2O5 (AEP), and K2O (AEK) averaged 13.4 (range 2.8 to 32.7), 12.8 (-5.4 to 28.5), and 13.9 (1.6 to 35.6) kg/kg, respectively. These values were slightly higher than the values (12.2 kg/kg, 11.5 kg/kg, and 10.4 kg/kg for N, P2O5, and K2O, respectively) reported for China by Jin (2012). It would appear that the crop response to nutrients in NW China is stronger than the country as a whole. One of the reasons for this could be attributed to the lower soil fertility in the NW (low soil OM) than other regions of the country (reflected in a higher yield response after fertilizer application). The low soil fertility in this region may be because of the absence of significant nutrient accumulation in these soils vis-à-vis the other intensive agricultural regions of the country (Li and Jin, 2011).
The pattern of macronutrient accumulation by the maize plant grown in Inner Mongolia is shown in Figure 3. Most of the accumulation (80% for N, 92% for P, and 85% for K) occurred within 80 days after sowing (tasseling stage), after which the accumulated nutrients (especially N and P) were rapidly transferred to the seeds. These trends suggest that the application of macronutrients needs to be done earlier in the maize growth to match plant demand.
Compared to the FP, OPT increased maize grain yields by an average of 1207 kg/ha and farmer’s income by more than USD 300/ha (Table 3) in Gansu and Xinjiang provinces. This could be due to under- or over-application of N and P in FP, and the fact that most farmers did not apply any K to the maize crop.
The results of this study illustrate three clear recommendations to maize growers in NW China: 1) Addition of K to N and P fertilizers is critical to optimizing yields and profits; 2) The large variability in crop response to all nutrients indicates the desperate need to develop fertilizer recommendation tools that consider more than just a soil test; and 3) The rates of N and P applied by farmers in NW China are very high given the yield responses obtained and this needs to change to avoid unnecessary profitability losses and environmental impact.
Dr. Li is Deputy Director, IPNI Northwest China program, Beijing, China; email: sli@ipni.net. Dr. Jin is Director, IPNI China program, Beijing, China; email: jyjin@ipni.net. Mr. Duan is Professor, Inner Mongolia Academy of Agricultural and Husbandry Sciences, Hohehot, China. Mr. Guo is Professor, Gansu Academy of Agricultural Sciences, Lanzhou, China. Mrs. Zhang is Professor, Xinjiang Academy of Agricultural Sciences, Urumqi, China. Mr. Li is Professor, Ningxia Academy of Agricultural and Forestry Sciences, Yinchuan, China.
References
Jin, J.Y. 2012. J Sci. Food Agric. 92:1006–1009.
Li, S. and J. Jin. 2011. Scientia Agricultura Sinica 44(20):4207-4229 (in Chinese).
MOA. 2010. China Agriculture Statistical Report. China Agriculture Press.
Portch S. and Hunter A. 2005. Special Publication No.5, PPI/PPIC China program.
| Table 1. Some chemical properties of soils at the experimental sites. | ||||||
| Locations | Year | pH | OM, % | N, mg/L | P, mg/L | K, mg/L |
| Wuwei, Gansu | 2003 | 7.9 | 0.75 | 14.5 | 22.6 | 124 |
| Jishishan, Gansu | 2004 | 7.6 | 0.12 | 81.4 | 5.3 | 140 |
| Wuwei, Gansu | 2006 | 7.8 | 0.85 | 4.3 | 15.6 | 98 |
| Zhangjiachuan, Gansu | 2006 | 8.2 | 0.85 | 0.0 | 11.6 | 144 |
| Wuwei, Gansu | 2007 | 8.2 | 0.93 | 23.1 | 34.3 | 96 |
| Zhenyuan, Gansu | 2007 | 8.1 | 0.78 | 13.4 | 7.6 | 90 |
| Awati, Xinjiang | 2005 | 8.0 | 1.41 | 47.0 | 5.7 | 97 |
| Changji, Xinjiang | 2006 | 8.2 | 1.17 | 21.3 | 13.6 | 93 |
| Uramuchi, Xinjiang | 2007 | 8.5 | 1.29 | 25.3 | 18.8 | 126 |
| Bozhou, Xinjiang | 2009 | 8.3 | 0.53 | 56.2 | 7.6 | 172 |
| Erdos, Inner Mongolia | 2009 | 8.8 | 0.24 | 16.2 | 10.6 | 97 |
| Erdos, Inner Mongolia | 2010 | 8.7 | 0.24 | 11.2 | 29.7 | 77 |
| Erdos, Inner Mongolia | 2011 | 8.5 | 0.18 | 16.7 | 34.7 | 62 |
| Wuyuan, Inner Mongolia | 2011 | 8.7 | 0.24 | 55.3 | 40.1 | 113 |
| Wuzhong, Ningxia | 2006 | 8.2 | 0.38 | 15.0 | 50.6 | 173 |
| Wuzhong, Ningxia | 2007 | 8.1 | 0.23 | 10.3 | 35.4 | 148 |
Figure 1. Average maize yields in different treatments at different sites.
Figure 2. Relationship of relative yield of maize in –P and –K plots with soil available P (left) and exchangeable K (right) for 16 site-years.
| ||||||
| Location | Yield response ------------- % ----------- | AE ---------- kg/kg ---------- | ||||
| N | P | K | N | P2O5 | K2O | |
| Wuwei, Gansu | 55.3 | 1.4 | 3.9 | 10.5 | 1.0 | 4.4 |
| Jishishan, Gansu | 32.4 | 30.5 | 16.9 | 12.2 | 17.5 | 21.7 |
| Wuwei, Gansu | 11.5 | 3.2 | 1.9 | 4.9 | 2.7 | 1.6 |
| Zhangjiachuan, Gansu | 12.5 | 18.7 | 14.9 | 4.2 | 11.9 | 12.2 |
| Wuwei, Gansu | 52.8 | 13.5 | 9.7 | 11.4 | 14.1 | 8.7 |
| Zhenyuan, Gansu | 55.0 | 20.6 | 6.6 | 22.9 | 16.6 | 6.0 |
| Awati, Xinjiang | 60.5 | 12.4 | 13.7 | 15.1 | 11.5 | 31.3 |
| Changji, Xinjiang | 6.2 | 20.7 | 12.4 | 2.8 | 27.3 | 35.6 |
| Uramuchi, Xinjiang | 8.3 | 19.3 | 7.8 | 4.5 | 19.0 | 12.0 |
| Bozhou, Xinjiang | 46.0 | 11.7 | 5.3 | 21.7 | 15.5 | 17.4 |
| Erdos, Inner Mongolia | 49.3 | 12.6 | 12.7 | 14.1 | 11.6 | 13.7 |
| Erdos, Inner Mongolia | 28.2 | 18.6 | 9.9 | 12.4 | 19.9 | 7.6 |
| Erdos, Inner Mongolia | 39.4 | 36.4 | 53.9 | 13.4 | 28.5 | 24.9 |
| Wuyuan, Inner Mongolia | 11.0 | 10.8 | 11.8 | 5.0 | 11.1 | 8.0 |
| Wuzhong, Ningxia | 607.4 | -4.3 | 7.5 | 32.7 | -5.1 | 8.0 |
| Wuzhong, Ningxia | 234.6 | 3.1 | 19.0 | 26.1 | 1.4 | 9.9 |
| Average | 81.9 | 14.3 | 13.0 | 13.4 | 12.8 | 13.9 |
Figure 3. N, P, and K accumulations by maize plant in Inner Mongolia.
| ||||||||
| Location | Year | Treatment | N, kg/ha | P2O5, kg/ha | K2O, kg/ha | Mean yield†, kg/ha | Cost‡, USD/ha | GRF§, USD/ha |
| Gansu | 2006 | OPT | 225 | 120 | 150 | 12000a | 393 | 3807 |
| FP | 300 | 150 | 0 | 11333b | 350 | 3617 | ||
| Gansu | 2007 | OPT | 300 | 120 | 150 | 13167a | 447 | 4161 |
| FP | 450 | 120 | 0 | 11900b | 431 | 3734 | ||
| Gansu | 2007 | OPT | 300 | 120 | 150 | 10367a | 447 | 3181 |
| FP | 450 | 120 | 0 | 9500a | 431 | 2894 | ||
| Gansu | 2007 | OPT | 225 | 150 | 150 | 11327a | 420 | 3544 |
| FP | 150 | 120 | 0 | 9395b | 215 | 3073 | ||
| Gansu | 2007 | OPT | 225 | 150 | 150 | 14533a | 420 | 4667 |
| FP | 225 | 150 | 0 | 12727b | 296 | 4159 | ||
| Gansu | 2007 | OPT | 300 | 120 | 150 | 8886a | 447 | 2663 |
| FP | 450 | 120 | 0 | 7904b | 431 | 2336 | ||
| Gansu | 2009 | OPT | 225 | 120 | 90 | 9028a | 344 | 2816 |
| FP | 150 | 105 | 0 | 8172b | 201 | 2659 | ||
| Gansu | 2009 | OPT | 225 | 90 | 60 | 9374a | 292 | 2989 |
| FP | 150 | 120 | 0 | 9006a | 215 | 2937 | ||
| Xinjiang | 2006 | OPT | 232 | 70 | 34 | 11286a | 259 | 3691 |
| FP | 274 | 172 | 0 | 10971a | 351 | 3489 | ||
| Xinjiang | 2009 | FP+K | 192 | 138 | 225 | 16637a | 448 | 5375 |
| FP | 192 | 138 | 0 | 14413b | 261 | 4783 | ||
| Xinjiang | 2007 | FP+K | 192 | 138 | 90 | 9763a | 336 | 3081 |
| FP | 192 | 138 | 0 | 8806b | 261 | 2821 | ||
| Xinjiang | 2008 | FP+K | 192 | 138 | 225 | 16637a | 448 | 5375 |
| FP | 192 | 138 | 0 | 14589b | 261 | 4845 | ||
| Xinjiang | 2010 | FP+K | 192 | 138 | 225 | 13808a | 448 | 4385 |
| FP | 192 | 138 | 0 | 12410b | 261 | 4082 | ||
| †For each location, mean yields followed by the same letter are not significantly different at p<0.05. ‡Total costs (USD) of N, P, and K fertilizers: N = $0.72/kg, P2O5 = $0.89/kg, K2O = $0.83/kg. (1 USD = 6.30 RMB) §GRF = gross return to fertilizers; Maize price = $0.35/kg. | ||||||||