09 Oct 2012
Agronomic Evaluation of Nutrient Management for Potato in Northwest China

Abstract: In northwest China the lack of knowledge on soil nutrient fertility and no appropriate nutrient management practice has restricted potato production. Field trials were conducted from 2002 to 2007 to determine the main limiting nutrients for potato (Solanum tuberosum L) and to evaluate the nutrient management practice (NMP) based on an Agro Services International (ASI) systematic approach. Results indicated average potato yields in nutrient omission plots was in the order 0-N (22.2 t ha-1) ≈ 0-P (22.4 t ha-1) <0-K (31.5 t ha-1). N deficiency is a general feature of irrigated potato in northwest region, whereas P and K supply are equally limiting factors. The mean agronomic efficiency of N (AEN), P (AEP) and K (AEK) was 34.4 kg tuber kg-1 N, 32.4 kg tuber kg-1 P2O5 and 41.3 kg tuber kg-1 K2O, respectively, and the mean partial factor productivity of N (PFPN), P (PFPP) and K (PFPK) was 220 kg tuber kg-1 N, 291 kg tuber kg-1 P2O5 and 306 kg tuber kg-1 K2O, respectively. There was significant negative relationship between AE or PFP of N, P or K and the respective nutrient rate. The positive relationship between yield of nutrient omission plots and PFP and AE suggests nutrient use efficiency can be affected by soil indigenous productivity. NMP based on ASI systematic approach produced significant higher yield, nutrient use efficiency and economic return than farmer practice (FP).
Keywords: Potato, Nutrient management, Agronomic efficiency, Partial factor productivity
1. Introduction
China is now the world's largest potato (Solanum tuberosum L.) producer and the output reached 74 million tons in 2007. The northwest region of China is the main potato production region with a planting area of 1.8 million ha and a total production of 24.4 million tones, accounting for 40.6% and 37.7% of national total, respectively (MOA, 2007).
The climatic conditions in the northwest region, such as cool temperatures, adequate sunlight, and a large differential between day and night temperatures are favorable for potato production. However, imbalances of nutrient application are partially responsible for the low tuber yields and quality of potato in this region where K and/or P has usually been ignored by farmer’s practice. Thus, nutrient management for N, P and K is important in potato production. However, the indigenous soil productivity and yield response to nutrient application were not clear, and appropriate nutrient management practices for potato are not available in northwest China.
Therefore, the objectives of this study were to: (1) determine the main limiting nutrient and nutrient use efficiency in potato production; (2) evaluate the nutrient management practice based on an Agro Services International (ASI) systematic approach.
2. Materials and methods
2.1 Field trials
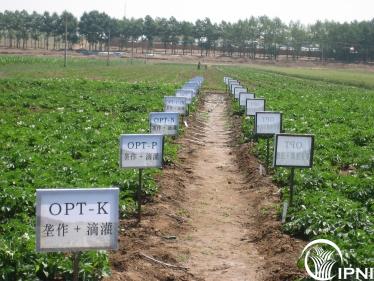
Field trials were conducted from 2002 to 2007. Each trial has a treatment of nutrient management practice (NMP) and nutrient omission plots: NMP-N, NMP-P or NMP-K. The amount of N, P2O5 and K2O applied in NMP was determined by the ASI systematic approach (Hunter, 1980; Portch and Hunter, 2002). Each trial had three or four replicates. In selected sites farmer practice (FP) was included to compare with NMP. Potato cultivars used in the experiments were round white and oblong yellows including the Chinese selections in the numbered series Kexin (Su and Lai, 2007), Longshu (Wen et al., 2007) and Qingshu (Zhang et al., 2006).
2.2 ASI systematic approach
ASI systematic approach was developed by Hunter (1980) and revised by Portch and Hunter (2002). Soil organic matter was extracted by 0.2 mol L-1 NaOH-0.01mol L-1EDTA-2% methanol and determined by spectrophotometry at 420nm. Soil-available P and K was extracted by 0.25mol L-1 NaHCO3-0.01mol L-1 EDTA-0.01mol L-1 NH4F solution, and P was determined colorimetrically, K by atomic absorption. Mineral N including NH4+-N and NO3--N were extracted by 1 mol L-1 KCl, and determined by colorimetry and ultraviolet spectrophotometer, respectively. The amount of N, P and K was recommended using fertilizer recommendation program based on organic matter content/mineral N, available P and available K, respectively. Descriptions of soil testing data are summarized in Table 1.
Table 1 Soil texture, soil pH, soil organic matter, and nutrient concentrations of tested soils prior to trials
Soil parameters | N trials (n=28) | P trials (n=34) | K trials (n=66) | |||
Mean (SD) | CV (%) | Mean (SD) | CV (%) | Mean (SD) | CV (%) | |
Soil texture | Sandy loam, loam | Sandy loam, loam | Sandy loam, loam | |||
pH in water (1:2.5) | 8.3 (0.3) | 3 | 8.2 (0.2) | 3 | 8.2 (0.2) | 3 |
Soil organic matter (g kg-1) | 10.0 (4.5) | 44 | 9.0 (5.0) | 59 | 9.0 (5.0) | 62 |
Mineral N (mg L-1) | 28.3 (22.9) | 81 | 24.2 (21.8) | 90 | 21.0 (20.2) | 96 |
Available P (mg L-1) | 16.3 (7.6) | 47 | 17.7 (7.6) | 43 | 17.0 (6.8) | 40 |
Available K (mg L-1) | 94.2 (34.7) | 37 | 97.2 (31.4) | 32 | 94.5 (30.7) | 35 |
2.3 Data analysis
Yield response and nutrient use efficiency including agronomic efficiency (AE) and partial factor productivity (PFP) was calculated. AE represents crop yield increase per unit nutrient applied and it was usually used to evaluate the yield increase derived from applied nutrient. PFP represents crop yield per unit nutrient applied and usually used to estimate the integrated use efficiency of both indigenous and applied nutrient.
Yield response (%) = (Y-Y0)/Y0×100
AE = (Y – Y0)/F
PFP = Y/F
Where Y = tuber yield of NMP (kg ha-1), Y0 = tuber yield (kg ha-1) of nutrient omission plots, F = nutrient applied (kg ha-1). AEN, AEP and AEK represent agronomic efficiency of N, P and K, and PFPN, PFPP and PFPK represents partial factor productivity of N, P and K, respectively.
Analysis of variance was completed using SAS statistical software. Plots and relationships were made and analyzed using Microsoft Office Excel 2007.
3. Results and discussion
3.1 Indigenous nutrient fertility and nutrient response
Initial soil analysis using the ASI approach indicated large variation in soil fertility characteristics among sites in N trials, P trials and K trials, respectively (Table 1). Seven- to 9-fold ranges of potato yields in nutrient omission plots were found among sites, with an average coefficient of variation (CV) in 53%, 53% and 43%, respectively for N, P and K (Table 2). Average potato yields in nutrient omission plots was in the order 0-N (22.2 t ha-1) ≈ 0-P (22.4 t ha-1) <0-K (31.5 t ha-1). Twenty-four of 28 N trials, twenty of 34 P trials and forty-two of 66 K trials showed significant (P<0.05) yield increase due to N, P and K application, respectively, indicating that N deficiency is a general feature of irrigated potato in northwest region, whereas P and K supply are equally limiting factors on many soils.
The average tuber yield response to N, P and K application was 20.8%, 14.9%, 16.4%, with the CV in 47%, 81%, 68%, respectively (Table 2). N recommended in this research was 45 to 307 kg N ha-1 with an average of 135 kg N ha-1. Studies completed in the Columbia Basin of Washington showed optimal N rates for Russet Burbank ranging from 336 to 448 kg ha-1 (Roberts et al., 1982; Lauer 1986). As for P, the application rate was 30 to 322 kg P2O5 ha-1 with an average of 124 kg P2O5 ha-1 (Table 2). Grewal and Sud (1990) reported that optimum dose of phosphorus for potato was 90 kg P2O5 ha-1 in northern India. Kumar et al. (2007b) indicated that response to P fertilization was significant with total tuber yield and biomass at the rate of 80 kg P2O5 ha-1, beyond that tuber yield did not further increase in west-central Plains of India. Most studies on K nutrition in potato focused on source, time and application method (Chadha et al., 2006; Sasani et al., 2006; Haase et al., 2007; Kumer et al., 2007c).
Table 2 Yield response and nutrient use efficiency indicators of potato grown in nutrient omission plots at various sites
| Measurement | Mean | SD | Min. | Max. | CV (%) |
| Yield in 0-N plot (t ha-1) | 22.2 | 11.8 | 7.5 | 54.6 | 53 |
| Yield in 0-P plot (t ha-1) | 22.4 | 11.9 | 5.9 | 55.7 | 53 |
| Yield in 0-K plot (t ha-1) | 31.5 | 13.7 | 8.2 | 56.0 | 43 |
| Recommended N | 135 | 58 | 45 | 307 | 43 |
| Recommended P2O5 | 124 | 83 | 30 | 322 | 67 |
| Recommended K2O | 139 | 68 | 30 | 300 | 49 |
| Yield response to N (%) | 20.8 | 10.0 | 3.1 | 44.0 | 47 |
| Yield response to P (%) | 14.9 | 12.1 | -1.0 | 62.7 | 81 |
| Yield response to K (%) | 16.4 | 11.1 | 2.3 | 57.1 | 68 |
| AEN (kg kg-1 N) | 34.6 | 19.0 | 3.4 | 80.0 | 56 |
| AEP (kg kg-1 P2O5) | 32.4 | 27.5 | -2.4 | 117.0 | 85 |
| AEK (kg kg-1 K2O) | 42.6 | 42.0 | 6.2 | 233 | 98 |
| PFPN (kg kg-1 N) | 220 | 122 | 67 | 622 | 55 |
| PFPP (kg kg-1 P2O5) | 291 | 218 | 50 | 934 | 75 |
| PFPK (kg kg-1 K2O) | 312 | 157 | 39 | 643 | 50 |
3.2 Nutrient use efficiency
The average AEN, AEP and AEK was 34.4 kg tuber kg-1 N, 32.4 kg tuber kg-1 P2O5 and 41.3 kg tuber kg-1 K2O. The average of PFPN, PFPP and PFPK was 220 kg tuber kg-1 N, 291 kg tuber kg-1 P2O5 and 306 kg tuber kg-1 K2O, respectively (Table 2). Many factors such as potato cultivars (Zebarth et al., 2004) and nutrient application rate can affect the variability of AE and PFP. In the current study there was negative correlation between AE or PFP and the amount of nutrient applied (Fig. 1). Other researchers also observed that AEN or PFPN decreased with increase dose of applied N (Zvomuya et al. 2002; Love et al. 2005; Kumar et al, 2007a). Curless et al (2004) showed that when 134 kg N rate ha-1 was applied, AEN was 46 kg tuber kg-1 N and PFPN was 348 kg tuber kg-1 N, which was higher than those of our experiment in which the mean AEN was 35 kg tuber kg-1 N and PFPN was 220 kg tuber kg-1 N when almost the same amount of N (135 kg N ha-1) was applied. In Canada the AEN and PFPN could be 117 kg tuber kg-1 N and 353 kg tuber kg-1 N at 100 kg ha-1 of N (Zebarth et al., 2006). For phosphorus, Kumar et al. (2007b) reported that there was a sharp increase in AEP or PFPP when the P dose was increased from 0 to 80 kg P2O5 ha-1 and the sharp decline in AEP was observed when the P dose was further increased from 80 to 120 kg P2O5 ha-1. The indigenous soil productivity can be expressed by the tuber yield in nutrient omission plots. So, the positive relationship between tuber yield of nutrient omission plots and PFP and AE (Fig. 2) suggest that indigenous soil productivity is another factor influencing nutrient use efficiency in addition to nutrient application rate.
Figure 1. Relationship between nutrient N, P, K application rates and AE (left) and PFP (right)
Figure 2. Relationship between tuber yield of nutrient omission plots and PFP (left) and AE (right)
3.3 Agronomic evaluation of NMP
Results indicated that NMP showed advantages in yield, economic returns and nutrient use efficiency (Table 3). The tuber yield of NMP plots increased over FP by 4.0% to 22.1%. Nutrient AE under NMP was greater than that of FP at almost all sites and the benefit from NMP was 20 to 500 US$ ha-1 more than that from FP. Future work should focus on understanding of nutrient cycling in potato system in order to develop the best nutrient management practice.
Table 3 Comparison between best nutrient management practice (NMP) and farmer’s practices (FP)
| Location | Year | Treat. | N kg ha-1 | P2O5 kg ha-1 | K2O kg ha-1 | Yield † kg ha-1 | Yield increase kg ha-1 % | AEN kg kg-1N | Benefit‡ US$ ha-1 | |
| Jishishan, Gansu | 2004 | NMP | 120 | 120 | 150 | 35350 a | 6333 | 21.8 | 74 | 1915 |
FP | 60 | 30 | 0 | 29017 b | 43 | 1680 | ||||
| Zhangjiachuan, Gansu | 2006 | NMP | 104 | 72 | 68 | 29583 a | 5347 | 22.1 | 55 | 3479 |
FP | 104 | 0 | 0 | 24236 b | 22 | 2978 | ||||
| Wuchuan, IMAR | 2006 | NMP | 125 | 125 | 100 | 14200 a | 900 | 6.8 | 33 | 728 |
FP | 60 | 18 | 0 | 13300 a | 40 | 708 | ||||
| Wuchuan, IMAR | 2006 | NMP | 250 | 225 | 200 | 31500 a | 1900 | 6.4 | 24 | 1666 |
FP | 141 | 51 | 0 | 29600 b | 23 | 1491 | ||||
| Huzhu, Qinghai | 2007 | NMP | 158 | 75 | 135 | 17893 a | 696 | 4.0 | 3 | 997 |
FP | 240 | 52 | 90 | 17197 a | 0 | 944 | ||||
| Xining, Qinghai | 2007 | NMP | 158 | 75 | 135 | 30893 a | 3393 | 12.3 | 35 | 1865 |
FP | 240 | 52 | 90 | 27500 b | 9 | 1631 | ||||
| Huaxian, Shaanxi | 2007 | NMP | 181 | 322 | 225 | 47916 a | 2083 | 4.5 | 33 | 2823 |
FP | 194 | 504 | 225 | 45833 b | 20 | 2583 | ||||
| Mizhi, Shaanxi | 2007 | NMP | 307 | 322 | 225 | 26527 a | 4027 | 17.9 | 17 | 1331 |
FP | 358 | 0 | 0 | 22500 b | 15 | 1312 | ||||
‡: Subtract the total cost of N, P, and K fertilizer from the total production value of potato tubers.
References
Chadha, S., S.S. Rana, Rameshwar, and D.R. Chaudhary. 2006. Effect of split doses of N and K and FYM level on the productivity of seed potato in cold desert regions of H.P. Potato J. 33 (1-2): 94-96.
Curless, M.A., K.A. Kelling, and P.E. Speth. 2004. Nitrogen and Phosphorus availability from liquid dairy manure to potatoes. Am. J. of Potato Res. 82: 287-297.
Grewal, J.S., and K.C. Sud. 1990. Potato response to phosphorus in northern India. Fert. News. 35: 25-29.
Haase, T., C. Schüler, and J. Heβ. 2007. The effect of different N and K sources on tuber nutrient uptake, total and graded yield of potatoes (Solanum Tuberosum L.) for processing. Europ. J. Agron. 26: 187-197.
Hunter, A.H. 1980. Laboratory and greenhouse techniques for nutrient survey to determine the soil amendments required for Optimum plant growth. Mimeograph. Agro Service International, Florida, USA.
Kumar, P., S.K. Pandey, B.P. Singh, S.V. Singh, and D. Kumar. 2007a. Effect of nitrogen rate on growth, yield, economics and crisps quality of Indian potato processing cultivars, Potato Res. 50: 143–155.
Kumar, P., S.K. Pandey, B.P. Singh, S.V. Singh, and D. Kumar. 2007b. Optimizing phosphorus requirement of chipsona varieties for west-central plains of India, Potato J. 34(3-4): 199-202.
Kumar, P., S.K. Pandey, B.P. Singh, S.V. Singh, and D. Kumar. 2007c. Influence of source and time of potassium application on potato growth, yield, economics and crisp quality. Potato Res. 50: 1-13.
Lauer, D.A. 1986. ‘Russet Burbank’ yield response to sprinkler-applied nitrogen fertilizer. Am. Potato J. 63: 61-69.
Long, C.M., S.S. Snapp, D.S. Douches, and R.W. Chase. 2004. Tuber yield, storability and quality of Michigan cultivars in response to nitrogen management and seed piece spacing, Am. J. Potato Res. 81: 347-357.
Love, S.L., J.C. Stark, and T. Salaiz, 2005. Response of four potato cultivars to rate and timing of nitrogen fertilizer, Am. J. Potato Res. 82: 21-30.
Ministry of Agriculture (MOA), PRC. 2007. China Agriculture Statistical Report. China Agriculture Press, Beijing, China.
Portch, S., and A. Hunter. 2002. A systematic approach to soil fertility evaluation and improvement. Modern Agriculture and Fertilizers, PPI/PPIC China Program Special Publication No. 5.
Rhue, R.D., D.R. Hensel, and G. Kidder. 1986. Effect of K fertilization on yield and leaf nutrient concentrations of potatoes grown on a sandy soil. Am. Potato J. 63: 665-681.
Roberts, S., W.H. Weaver, and J.P. Phelps. 1982. Effect of rate and time of fertilization in nitrogen and yield of ‘Russet Burbank’ potatoes under center pivot irrigation. Am. Potato J. 59: 77-86.
Sasani, G.V., C.K. Patel, R.N. Patel, N.H. Patel, and S.H. Patel. 2006. Efficient use of water and fertilizers through drip fertigation in potato. Potato J. 33(3-4): 131-133.
Su, X.T., and L.B. Lai. 2007. Performance of potato variety Kexin No. 18 sown in winter and its high-yielding cultivation techniques. China Potato J. 21: 118-119.
Wen, G.H., Y.H. Wang, and G.F. Li. 2007. A new potato variety-‘Longshu no. 6’. China Vegetables. 6: 29-31.
Zebarth, B.J., G. Tai, R. Tarn, H. de Jong, and P.H. Milburn. 2004. Nitrogen use efficiency characteristics of commercial potato cultivars. Can. J. plant Sci. 84: 589-598.
Zebarth, B.J., W.J. Arsenault, and J.B. Sanderson. 2006. Effect of seed piece spacing and nitrogen fertilization on tuber yield, yield components and nitrogen use efficiency parameters of two potato cultivars. Am. J. Potato Res. 83: 289-296.
Zhang, Y.C., T.C. Na, L. Shi, H.L. Sun, and J.P. Yuan. 2006. Selection of a new potato variety Qingshu no. 8. China Potato J. 20 (6): 380-381.
Zvomuya, F., C.J. Rosen, and J.C. Miller Jr. 2002. Response of Russet Norkotah clonal selections to nitrogen fertilization, Am. J. Potato Res. 79: 231-239.


