22 Mar 2017
To replace or not to replace? - that is the question
Nutrient replacement strategies
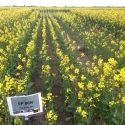
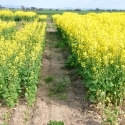
 Wheat
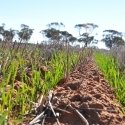
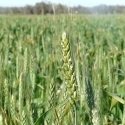
Wheat
Nutrient replacement is often discussed when considering rates after either good or poor seasons. Irrespective of off-takes, the general rule remains the same, the nutrient removed has to come from somewhere - from the fertilizer applied and/or from the soil reserves, and often both. So balancing fertilizer application with removal of particularly P and K depends on the soil test values and various loss processes. If application is less than replacement and losses, soil test goes down; If application is more than replacement and losses, soil test goes up.
If soil test is low, then a BUILD strategy is appropriate, while if the soil test is high, then a BRING-DOWN strategy is appropriate. If soil test is within the critical range, then BALANCE is appropriate.
First – what is the removal?
IN GRAIN
Obviously nutrient removal in grain depends on the yield and the P and K concentrations of the grains. Table 1 gives some ranges for grains – and they can be quite variable. Grain concentrations are higher with high soil test values reflecting high levels of soil supply.
Table 1: Removal figures for P and K in grain, with different stubble management systems Figures are in dry weights (0% moisture content).Values in parentheses are the standard errors ("normal" range) for these values from the studies cited.
P kg/t | K kg/t | Yield t/ha | P rem kg/ha | K rem kg/ha | |
| Wheat grain* | 3.3 (0.7) | 4.6 (0.6) | 6 | 20 | 18 |
| Wheat stubble*** | 0.7 | 21 | 8 | 4 | 168 |
| Wheat Stubble burned | 40% loss | 40% loss | - | 2 | 70 |
| Canola grain** | 5.7 (1.1) | 6.7 (1.0) | 3 | 17 | 20 |
| Canola stubble*** | 2 | 24 | 6 | 12 | 144 |
| Canola stubble burned | 40% loss | 40% loss | - | 5 | 60 |
** Values from Norton RM. 2014. Canola seed nutrient concentrations for southern Australia. http://anz.ipni.net/ipniweb/region/anz.nsf/0/0C598E0085BBA369CA257D69000B5FD9/$FILE/Norton%20ARAB%20Canola%20Paper.pdf
*** Wheat and canola stubble Parker. Canola Best Management Guide, Chapter 7 (See downloads).
IN STUBBLE
Nutrient levels in stubbles can be quite variable and some references suggest that canola stubble has 10-14 kg K/t of stubble (eg Brennan pers.comm) while others suggest 26 kg K/t of stubble. Values in Table 1 for stubbles are from the literature.
Stubble management also affects nutrient removal. If the stubble is left then the nutrients in the stubble also remain, although they may not be evenly distributed across the paddock unless a straw spreader is used.
If the stubble is baled and removed, then the amounts in Table 1 will also be removed. This is particularly so for K which has much higher concentrations in the stubble than the grain.
If the stubble is burned, then depending on the age of the stubble and the amount of weathering it has gone through, then around 40% of the P and K will be lost in a hot burn. If weathered, the P and K may be leached from the stubble so losses are smaller.
OTHER LOSS PROCESSES
Soil erosion is the major way in which P and K are lost as they both rapidly adhere to clay particles. Fixation of nutrients into less available pools can also occur and for P, the amount tied up is indicated by the Phosphorus Buffering Index (PBI) which is soil type dependant and a low PBI (<120) suggests that less than I kg P/ha is tied up. K is also tied up but there are no standard tests available to assess those amounts.
So – removal from a 6 t/ha wheat crop or a 3 t/ha canola with stubble retained on a low PBI soil could remove around 20 kg of both P and K. If the stubble was burned, P losses would be a little higher, but K losses would increase 3 to 4 fold.
Second - how much of the removal needs to be replaced?
The amount to replace depends on the
- Soil test value – which reflects the amount present in the soil that the crop can or has drawn down.
- Losses of nutrients by soil erosion, leaching, or other processes. For P and K the losses are mostly by erosion.
- Fixation of nutrients into less available soil pool
The soil test is the critical part of deciding the to BUILD, BALANCE or BRING-DOWN.
Build Strategy
If soil test levels are less than the critical range, the amount to apply will be the removal plus PBI plus an amount to move the soil test towards the critical range. Research in pastures indicates that the amount of P required to raise soil test values varies among soil types, but with a PBI of 100 it is likely to be in 2.5 to 3.0 kg P over removal to lift one Colwell P one unit. A PBI of 400 would require 2.9 to 3.3 kg P over removal (Burkitt et al, 2002).
- So following a 6 t/ha wheat crop, with a low soil test and moderate fixation capacity, more than replacement is required – that is more than 22 or so kg P/ha. If 9 kg P/ha extra was supplied (31 kg P/ha), the soil P test could increase three units. (Values are as examples only)
- Building to critical may best be considered by small excesses over several years, rather than trying to do it in one or two years.
Balance Strategy
If the soil test is at or near the critical range, then to avoid the soil test declining, a maintenance or replacement rate of nutrient should be added, with appropriate adjustments for fixation and losses.
- So following a 6 t/ha wheat crop, with a moderate soil test and moderate fixation capacity, replacement is required – around 22 or so kg P/ha. (Values are as examples only)
Bring-down Strategy
If the soil test levels are above the critical range, the response to extra P likely be small. There is little benefit operating soil fertility significantly above these critical values, so applying less than removal will exploiting the soil reserves and so reduce the soil test values.
- So following a 6 t/ha wheat crop, with a high soil test and moderate fixation capacity, less than replacement can be adopted – that is less than 22 or so kg P/ha. If 10 kg P/ha was used, (12 kg less than removal), the soil P test could decrease by four units. (Values are as examples only)
- Soil test is likely to go down faster than it rose – because grains are likely to be higher in P or K at high soil test levels. Monitoring is important.
- For P in particular, there is usually a small – but significant – response to having some P in the furrow where the crop can access it early in growth.
Additional Resources
Canola Best Management Guide - Chapter 7Size: 0.72 MB