27 Feb 2017
Potassium responses on wheat and canola at Glenthompson, 2016
Field work undertaken in association with Southern Farming Systems.
 K deficiency in wheat
Potassium (K), along with nitrogen (N) and phosphorus (P), are the three essential nutrients required from soils by crops and pastures in large quantities. Typically, plant K demand is similar to N, although most of the K is present in stems and leaves rather than seeds. Table 1 shows typical N, P and K concentrations in some crop products. It is clear that where stubbles are removed or hay cut, K removals are very high, so particular attention to K nutrition should be given to those paddocks.
Table 1. Nutrient composition and removal of some typical field crop products at typical field moisture contents.
| Crop | N (kg/ha) | P (kg/ha) | K (kg/ha) | S (kg/ha) |
| Wheat (6 t/ha,12% ptn) | 125 | 18 | 21 | 7 |
| Canola (3 t/ha, 23% ptn) | 90 | 15 | 20 | 15 |
| Barley (5 t/ha, 10% ptn) | 90 | 15 | 23 | 6 |
| Wheat Stubble* baled (7.5 t/ha) | 56 | 6 | 109 | 9 |
| Wheat Stubble* burned (7.5 t/ha) | 46 | 3 | 44 | 6 |
| Lucerne Hay (5 t/ha) | 150 | 10 | 120 | 13 |
The agricultural-induced deficiency of K has been attributed to leaching below root-zones and the removal of K in product (hay, silage) along with the redistribution by grazing animals. Most sandy soils in the WA region are now K-deficient for crop production (Brennan et al. 2004). Similarly, negative balances are common in all broad-scale cropping systems of eastern and northern Australia including the Western District of Victoria.
Across regions within the Western District, potassium fertilisers have been applied to pastures but there is little data on their use on field crops. A survey of paddocks in the region from 2010-2014 showed few paddocks received K fertilizers, and those that did received only modest amounts so that all areas were removing more K that was being supplied (Norton 2017).
While this would be a reasonable position if soil K supplies were adequate, but Christy et al. (2013) showed that up to half of the soils, particularly in the western part of the Western District showed apparent low soil test (Colwell) K status. Even though the critical soil test values have been published for pastures (Gourley et al. 2007) and crops (Bell and Brennan 2013) the data used to generate these values for crops have no information from this area on which critical values can be based. The current best estimates for critical Colwell K levels are between 126-161 mg/kg for pastures, 40-50 mg/kg for wheat and 43-45 mg/kg for canola. These values demonstrate a huge gap between pasture and crop critical values and part of the trial reported here is to provide those experiments to validate soil test values for crops, as well as assess the responses in the high rainfall zones.
Method
A field site near Glenthompson was selected for the field experiment, A summary of the soil tests is given in Table 2, and the Colwell K levels were below a critical value for pastures but above the values for crops. Canola (Hyola650TT) and wheat (Beaufort) were planted on May 12, 2016. Wheat and canola were both treated with fungicidal seed dressings. At seeding 100 kg/ha MAP was used and the site was top-dressed with 50 kg N/ha as urea in August along with 250g Cu/ha applied as copper sulfate.
Table 2: Selected test values for the Glenthompson K experiment, 2016.
| Analyte | Unit | 0-10 cm | 10-20 | 20-30 |
| Colwell K | mg/kg | 93 | 76 | 127 |
| Colwell P | mg/kg | 43 | 44 | 49 |
| pH (CaCl2) | - | 6.1 | 5.5 | 5.7 |
| Organic Carbon | % | 4.7 | - | - |
| CEC | cmol(+)/kg | 12 | 9 | 11 |
Potassium, as potassium chloride (muriate of potash) was supplied either at seeding or at the crop 5 leaf stage (GS15). The fertilizer and seed were separated at seeding to avoid damage. Emergence counts were taken, along with biomass cuts at mid-flowering, and final seed yields for all K treatments and both crops. The biomass samples from the at-seeding K treatments were analysed for K concentration, as well as other nutrients. Results were analysed as a factorial configuration of crop*Krate*timing. The results presented are derived from three of the four replicates, with replicate one excluded because of poor weed control.
Results and discussion
Establishment counts indicated that the was no significant difference in emergence numbers, which may be a consequence of good moisture levels at seeding and the fact the seed was not mixed in the furrow with the fertilizer. Canola establishments counts/m2 were 628 (seeding) and 668 (GS15), while wheat counts were 558 (seeding) and 598 (GS15). Under the conditions prevailing and the machinery used at seeding, the salt-effect of muriate of potash was not an issue. Adequate seed and fertilizer separation in twin chuting systems is around 2.5 m, and where single chuting is available, the potential for damage varies with crop, fertilizer, row spacing, ground engaging tool, soil texture and moisture content and there is a web-based tool that can assist estimating the risk of particular combinations (IPNI 2015, http://seed-damage-calculator.herokuapp.com) .
The biomass samples taken at mid-flowering showed that both crops accessed the added K, and over all K treatments the canola crop accumulated 91 kg K/ha at mid-flowering, compared to the wheat crop 44 kg K/ha. The crops showed similar patterns of uptake in response to added K, indicating that the fertilizer was available to the crop, although it is recognised that K is often “luxury” accumulated during growth. It is also recognised that the extended growth patterns of canola could explain the higher K uptakes compared to wheat (Rose et al. 2007). Other research undertaken in the southern tablelands of New South Wales has shown that canola is much less responsive to K supply than other crops – with the responses to 100 kg K/ha at seeding were 113%, 54% and 28% for wheat, triticale and canola respectively (J. Holland, NSWDPI, unpublished).
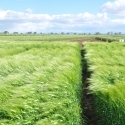
Even though the yield responses were inconclusive, the typical symptoms of K deficiency were seen on the wheat crop during mid-spring (Figure 1). Because K is highly mobile within plant tissue deficiency symptoms are generally visible on the older leaves first. Deficiency symptoms include scorching or burning along the leaf
margins, and generally poor growth resulting in smaller root systems, small leaves, weak stems (inducing lodging in mature plants) and small and shrivelled grain, although these features were not seen in the harvested wheat grain.
Figure 1, Symptoms of K deficiency seen in the wheat plots with nil K at the Glenthompson site, October 2016.
The crop yield responses differed between wheat and canola. Despite accumulating twice as much K as the wheat crop, there was no yield response to the supplementary K (Figure 2). The pattern for wheat showed a response to the first 25 kg K/ha of approximately 1 t/ha, but the next 25 kg K/ha saw yields decline to be similar to the check plots. The highest K rate gave a response similar to the 25 kg K/ha treatment. The reasons for this are uncertain. While there were no yield responses noted to applied K in the canola, it was observed that the nil K canola finished flowering earlier than the K sufficient plots - although this maturity difference did not come through to yield.
The soil test values for top soil and subsoil K would suggest that there would be no response to added K in either crop, with a Colwell K twice the critical value. Despite that, there was a response to added K to the wheat crop, albeit inconsistent at the 50 kg K/ha rate. Whether this was a consequence of un-even weed control or a real response by the crop to added K will only be determined by additional field work.
Figure 2. Wheat and canola yields in response to potassium at Glenthompson, 2016. Error bars represent the standard error of the means.
Conclusion
While a positive response to applied K was recorded for wheat, but not canola, at this site which would be considered “non-responsive” based on the Colwell K soil tests. The data is far from conclusive but does warrant further investigations given the depletion of soil K through product removal under modern cropping systems.
Acknowledgments
Thanks to the farmers who hosted the sites and SFS staff for trial management. This trial was fully funded by the International Plant Nutrition Institute, Australia and New Zealand regional program.
References
Bell M, R Brennan 2013. Soil potassium-crop response calibration relationships for field crops grown in Australia. Crop and Pasture Science, 64, 515-522.
Christy B, Clough A, Riffkin P, Norton R, Modwood J, O'Leary G, Stott K, Weeks A, Potter T. (2015). Managing crop inputs in a high yield potential environment - HRZ on southern Australia. State of Victoria Department of Economic Development, Jobs, Transport and Resources. Melbourne. 36 pp.
Gourley C, A Melland, R Waller, I Awty, A Smith, K Peverill, M Hannah (2007) Making better fertilizer decisions for grazed pastures. Department of Primary Industries, June 2007, Melbourne. 20 pp,
IPNI (2015). Seed and fertilizer compatibility. http://anz.ipni.net/article/ANZ-3261
Norton R (2017). Potassium removal and use in Australia. T.S. Murrell and R.L. Mikkelsen (Eds.). Frontiers of Potassium Science. Rome, Italy. 25-27 Jan. 2017. International Plant Nutrition Institute, Peachtree Corners, GA, USA. p33-44.


Additional Resources
Report on K responses by wheat and canola, 2016Size: 0.41 MB