06 Jul 2015
Phosphorus – how much can we reduce P?
How low can you go?
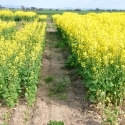
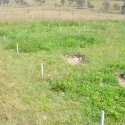
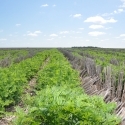
 Dahlen Long Term Fertilizer Experiment, 2010, nil p versus 18 kg/ha P in canola
Paper presented at the 2015 GRDC Advisor Updates, Ballarat February, Nhill Grower Update (February) and Tooleybuc Grower Update (July).
Getting phosphorus right at seeding sets the foundation for good early vigour and – as yet – there are no proven in-crop P interventions that can make up for early deficiencies. There has been widespread interest in “foliar P” (Noack et al. 2010), the results have been mixed (McBeath et al. 2011) and this may be a consequence of changes in leaf properties under P deficiency that make them less permeable to foliar P (Peirce et al. 2014). The research over the years has been clear that the right time and the right place for P is near the seed as it germinates and emerges. P uptake is essentially linear until booting in wheat, with about 25% in each of the roots and leaves, and the balance in the growing stem (Rose et al. 2007). Even though uptake continues until booting, the early rooting pattern is set as the roots seek out and then proliferate around fertilizer bands (Officer et al. 2009a) and this pattern can set up the foraging pattern up to booting.
Soil moisture status influences rooting patterns and so under dry conditions, P acquisition particularly is more reliant on banded fertilizer P rather than P from the bulk soil (Officer et al. 2009b) – another reason to band. After the 2002, 2006, 2007 and 2008 droughts there have been publications to assist growers with their decisions coming into the following seasons (see http://anz.ipni.net/article/ANZ-3223). While there are many issues including herbicide carryover, weed burdens, subsoil moisture, crop diseases and managing cash flow, the most common question is about the opportunity to adjust fertilizer inputs especially P.
In non-calcareous soils less of the P applied in a dry year will be immobilized than in a more normal year. In calcareous soils though, the P losses through fixation are probably not greatly affected. The early part of the 2014 season was quite good in many regions, so the processes in both calcareous and non-calcareous soils were likely similar to a “normal” year (Reuter et al. 2007).
Soil test for P status
The first issue is to identify the starting position going into the season, and soil testing is the obvious and most reliable way to do that. Key message number 1 is take a good sample – and for P depth is critical as most P is in the top soil, so shallow samples over-estimate soil test values, and deeper samples underestimate the true value. Representative ten centimetre deep samples are critical to interpret the current soil P tests. And yes – the Colwell soil test is still reliable indicator of the potential response to added P. Use an ASPAC accredited laboratories and a FertCare® advisor.
Crop yield is affected by soil test values, and Figure 1 shows the style of this relationship. As soil test value increases, if the nutrient in question is the limiting factor, then the yield will increase – often as a curve of diminishing returns until there is a soil test value beyond which yield does not increase – this is the Ymax value. The soil test value that corresponds to 90% or 95% of Ymax is the critical soil test value. At high and reliable yields, operating with at 90% Ymax may not below an economic optimum.
Figure 1 Relationship between soil test level and relative yield showing the critical values and the management implications for different soil test values.
Adding P to soil – at any soil test level - will go generally to three places, assuming no soil erosion or leaching. Some will enter the available pool of P, which can then raise the soil test value. Some P will be fixed into less available P pools (such as organic, calcium, iron or aluminium P) and so will be “lost” for some period of time. The amount fixed can be assessed by reference to the soil P buffering capacity. The third place for P is to be taken up by the plant roots from the available P pool and so removed in the grain.
Table 1 Critical Colwell soil test values and ranges as taken from the Better Fertilizer Decisions for Crops database (Bell et al. 2013).
| Crop | Soil Type | Critical Value (mg/kg) | Critical Range (mg/kg) |
| Wheat & Barley | Vertosol | 17 | 12-25 |
| Chromosol/Sodosol | 22 | 17-28 | |
| Calcarosol | 34 | 26-44 | |
| Brown/Red Chromosols | 25 | 18-35 | |
| Barley | Ferrosols | 76 | 46-130 |
| Canola | All soils | 18 | 16-19 |
| Field pea | All soils | 24 | 21-28 |
Table 1 shows the critical phosphorus soil test values based on data from the Better Fertilizer Decisions for Crops (Bell et al. 2013). Values differ by soil type and crop, and the values indicate that canola is less responsive than wheat or barley on many soils although the dataset is incomplete so true comparisons are difficult to make. There is a suggestion that wheat after canola is more P responsive than wheat after wheat, possibly because the canola is quite efficient at accessing soil P.
Balance off-take and input over time.
The amount of P that crops access from fertilizer is relatively low – 25% or so, and this is because the soil and plant are competing for the applied P. A high PBI soil will demand a lot of the P applied, but if the soil test is above the critical value, there will be some P replenishes the available P pool. At those levels, a maintenance program can be implemented where application is equal to removal plus a contribution to the fixed soil pool. Below the critical soil test value, yields are limited by their access to adequate P, and so there is a need to build soil P levels, as well as accounting for P removal.
Figure 2 P balance for the Incitec Pivot Dahlen long-term N*P experiment over time, showing soil test values and P recovery.
The Incitec Pivot Dahlen long-term nutrition experiment has been following soil P status over 18 years and the trends in P balance (applied fertilizer P less removed P in grain) (Figure 2). The starting Colwell P was 24 mg/kg and over time, and with P applied at 9 kg P/ha/y, the Colwell increased to 40 mg/kg, and around 88% of the P applied was recovered in the grain. If no P was added, then the Colwell P declined to 17 mg/kg. So on this site, which has a relatively low PBI (115), to raise the soil test P level one unit requires somewhere around 2 to 4 kg of P in excess of removal. The preliminary results from a new series where P is withheld on some plots suggests that soil test P declines at a faster rate than it increases. The graph in Figure 2 also shows that soil P balance, and so soil test value changes relatively slowly – at the 9 kg P/ha/y, during the “good” years of 1998-2001 the rate applied was in balance with removal. During the “poor” years, there was more applied than removed and so soil test increased. Since 2010, the balance has been essentially restored. The point here is that soil tests change relatively slowly, and in response to P balance, it is the long term balance of removal against supply that is important, not necessarily so annual aberrations.
Cut P rates in the short term but keep some P near the seed
In many areas, grain yields and therefore P removal was low. If the crop was salvaged for hay - P was still removed. Cereal hay removes around 1 kg P/ha/t, while grain removes around 2.5 kg P/ha/t. Canola hay removes around 3 kg P/ha/t. In any case, knowing the P removal is important - grain P can vary from 1.8 to 4.5 kg/t - so getting grain tested will give a guide to the actual P removed. Irrespective of the amount removed, the soil test value will decline.
On neutral to moderately acid soils, much of the P applied is still likely to be available, so reduced rates are feasible. On high PBI calcareous soils, P fixation can still occur even under dry conditions, so using fluid P in furrow may be a good option if good delivery equipment is available. Even so, MAP and DAP are still reliable sources in many situations. There is always a caution with high rates of seed placed fertilizers, including MAP and DAP, especially with wide rows, knife points or discs, and on light and dry soils with small seed.
The research after the millennium drought years showed that it was possible to reduce P input. A barley trial from NSW showed that low rates of seed row P showing benefits even when there were high P rates in the drought year. This local effect is a result of poor P mobility so there is a response to having some P in the seed row, or alternatively a penalty to not having seed row P. I also did some trials on the Kalkee Plains after the 2006 and found the same. The results from the long-term N*P experiment at Dahlen, also show that having some seed row P has a benefit even where soil tests are high. The effect is generally small but is statistically significant. For more details see: http://anz.ipni.net/article/ANZ-3217.
There is nearly always a benefit to having some P in the seed row, and rates of 3-5 kg P/ha should be considered as the bottom line. Lower rates are likely to be less evenly distributed so give poor results. For example on 25 cm row widths, supplying 2 kg P/ha would mean that – on average - granules are between 8 and 12 cm apart (depending on product) in the drill row. Narrower rows make this spacing even more distant. This makes early engagement of roots with fertilizer a chancy business
Is P running out globally?
The most recent comprehensive assessment of phosphate rock reserve and reserve base was undertaken by the USGS (2013) estimates that there are 67,000 milion tonnes of known rock reserves and an annual consumption of around 220 million tonnes. They estimate the total rock P resource as four times the current reserve. This does not mean growers and the fertilizer industry should be complacent. Phosphorus is a non-renewable resource and using fertilizer best management practices to ensure efficient use of P is a critical component of wise nutrient stewardship. This will also include investigating strategies to recycle P – for example using manures and composts - as well as ensuring as much soil P is retained on farm by reducing soil erosion.
Conclusions
The best way to find out if P is running down on your farm is to soil test and then assess if the program needs to build or rebuild fertility using P rates above removal, or if at maintenance, use P rates around long term removal.
Rates can be reduced, but keep some fertilizer in the drill row to help with early P nutrition.
References
Bell et al. 2013. Crop and Pasture Science, 64, 480-498.
Flavel et al. 2014. Plant and Soil. 385, 303-310.
McBeath et al. 2011. Crop and Pasture Science, 62, 58-65.
Noack et al. 2010. Crop and Pasture Science, 61, 659-669.
Officer et al. 2009a Australian Journal of Soil Research, 47, 91-102.
Officer et al. 2009b Australian Journal of Soil Research, 47, 103-113.
Peirce et al. 2014. Plant and Soil 385, 37-51.
Reuter et al. 2007 Fertilizer P management after the 2006 drought. Available at http://anz.ipni.net/article/ANZ-3223
Rose et al. 2007. Journal of Plant Nutrition and Soil Science, 170, 404-411.
USGS 2013. http://minerals.usgs.gov/minerals/pubs/mcs/2013/mcs2013.pdf
Additional Resources
Download presentationSize: 30.82 MB