01 Apr 2014
The effect of K applied at different times to wheat, Western Australia
Responses on a sandy soil in pot and field experiments
 K deficiency in wheat
THE EFFECT OF POTASSIUM FERTILISER APPLIED TO SANDY SOILS AT A SERIES OF DIFFERENT TIMES FOR THE GROWTH OF WHEAT.
R.F Brennan
Western Australia Department of Agriculture and Food, 444 Albany Highway, Albany, WA 6330, Australia. Email: ross.brennan@agric.wa.gov.au
Summary
In a glasshouse experiment, wheat (Tritium aestivum L.) was grown on yellow sand with a Colwell soil extractable K of 22mg/kg, a soil test level expected to be deficient for the growth. Several levels of K, as sulphate of potash, were plied to give a range of K additions from deficient to an adequate supply K for dry weight of shoots and grain. The K was applied at 4 growth stages through the season. The timing of application ranged from 2-3 leaves through to boot stage of cereal.
Similarly, in a field experiment, wheat (Tritium aestivum L.) was grown on a yellow sand with a Colwell soil extractable K of 37mg/kg. Several levels of K, as sulphate and muriate of K were applied to give a range of K additions from deficient to adequate supply for grain yield. The K was applied at 5, 10 & 15 weeks through the season. The timing of K application ranged from 2-3 leaves through to boot stage of cereal. There was no significant difference between the 2 K sources. About 1.5 -2 times more K needed to be applied at 5 weeks compared to the 10-week application. This may indicate losses of K fertiliser from the root zone by early leaching rain.
Results show that early applications of K are essential for maximum yield and growth. Late applications of K fertiliser allow insufficient time for the plant to recover and reach maximum yield.
Foliar applications at late stage were not considered at this stage of research.
Glasshouse Experiment
In a glasshouse experiment, wheat (Triticum aestivum L.) was grown on yellow sand collected from a field site where the K had never been applied. The Colwell soil extractable K was 22 mg/kg, a soil test level expected to be deficient for the growth and yield.
Several levels of K, as sulphate of potash were applied from deficient to an adequate supply of K for grain yield. The K was applied at 4 growth stages through the season. The timing of application ranged from 2 leaves through to 6-7 leaf stage.
The air-dried soil was passed through a 3.8 mm sieve, and collected in plastic lined bags. The soil was thoroughly mixed before being potted into 22.5 cm diameter pots lined with polyethylene bags. To each pot containing 7 kg of soil the following basal nutrients were added in solution (mg): 1200 NH4H2P04; 164 MgSO4.7H20; 100 MnS04.H2O; 35 ZnSO4.7H2O; 35 CuSO4.5H2O, 430 NH4NO3, 1.6 Na2MoO4.2H20, 1.6 CoSO4.7H2O and 1.5 H3BO3. Gypsum (CaSO4.2H2O) was applied at 400 mg as a solid to the soil surface. The basal nutrients were added to the soil surface and allowed to dry. After the solutions had dried, all nutrients were mixed throughout the soil by shaking the soil in polyethylene bags. Seed of wheat cv. Calingiri was sown at 12 per pot about 2 cm deep into soil watered to 75% of field capacity (9g of H2O per 100 g soil) with de-ionise water. After 14 days, seedlings in each pot were thinned to 8 uniform plants. For the first 14 days, soil in each pot was maintained at 75% of field capacity using deionised water. After this period, the soil was regularly maintained at field capacity (12g of H2O per 100 g soil) by frequent weighing and watering. Pots were re-randomised in the glasshouse at each watering.
At harvest, the heads from the remainder of the shoots (ROS). Plant sample were oven dried, and grain (seed) dried to constant % moisture.
Results
- (a) Head number
Note IAS is for immediately after seeding the pots with Calingiri wheat
Figure 1. The effect of K application at several growth stages of wheat through the growing season on the (number of heads (ears) [No. /pot]. The diamond is the first application at IAS followed closed square applied at 2 leaf stage, closed triangle applied at 4 leaf stage and then closed circle at time 4 [closed square blue]. Excel fits to data.
Conclusion: - late application of K decreased the number of heads (ears) produced. Early correction of K is essential for ears to be produced. The maximum ear number was about 60% by delaying the correction of K deficiency from at seeding to the 6-7 leaf stage.
- (b) Grain Yield (g/pot)
Note IAS is for immediately after seeding the pots with Calingiri wheat
Figure 2. The effect of K application at several growth stages of wheat through the growing season on the grain yield [g/pot]. The diamond is the first application at IAS followed closed square applied at 2 leaf stage, closed triangle applied at 4 leaf stage and then closed circle at time 4 [closed square blue]. Excel fits to data.
Conclusion: Fig 2- late application is ineffective to correct severe K deficiency. To achieve about half the maximum grain weight at time 3, about 3 times more K needed to be applied. The maximum grain yield was about halved by delaying the correction of K deficiency from at seeding to the 6-7 leaf stage.
Grain weight
Table 1. The effect of K application at several growth stages of wheat through the growing season on the grain weight [mg/seed].
| K applied | T1 IAS | T2 (leaf stage) | T3 (4leaf stage) | T4 (6-7 leaf stage) |
0 | -A | - | - | - |
7.5 | 28.85 | 27.27 | 27.64 | 29.78 |
15 | 35.33 | 37.98 | 37.10 | 32.61 |
30 | 35.97 | 35.11 | 34.34 | 28.27 |
60 | 38.59 | 39.33 | 37.00 | 38.76 |
120 | 40.00 | 37.78 | 37.60 | 37.90 |
Delaying the application of K to severely deficient soil had no significant effect on grain weight. Other components of yield such as number of ears produced (figure 1), and grains per ear need to be determined.
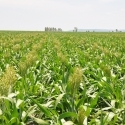
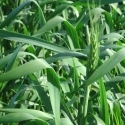
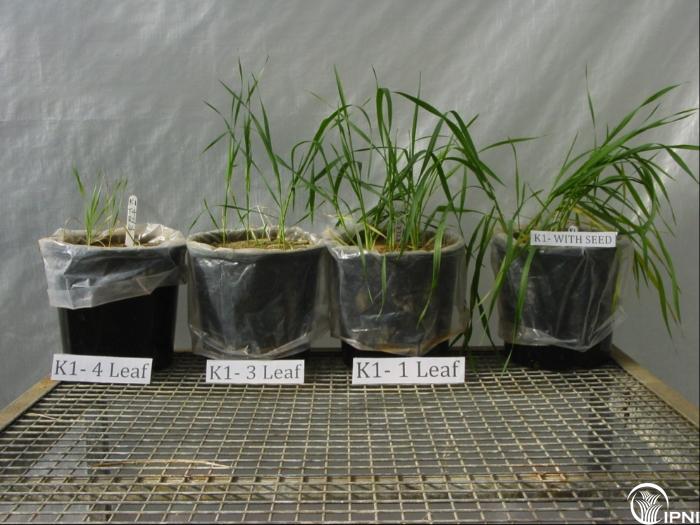
Photo 1. The effect of K fertiliser (K1) on vegetative growth applied at 3 different growth stages compared to the same level applies IAS (labelled as “with the seed” on the far right).
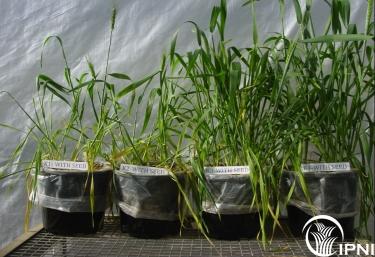
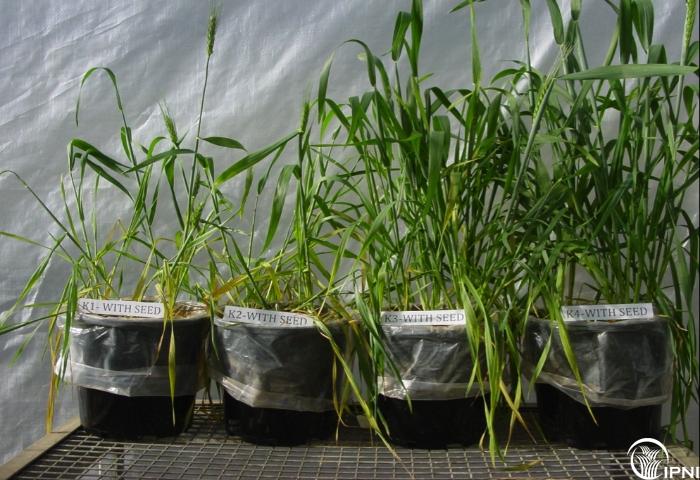
Photo 2. The effect of K fertiliser (K1- K4) on vegetative growth applied at seedling stage
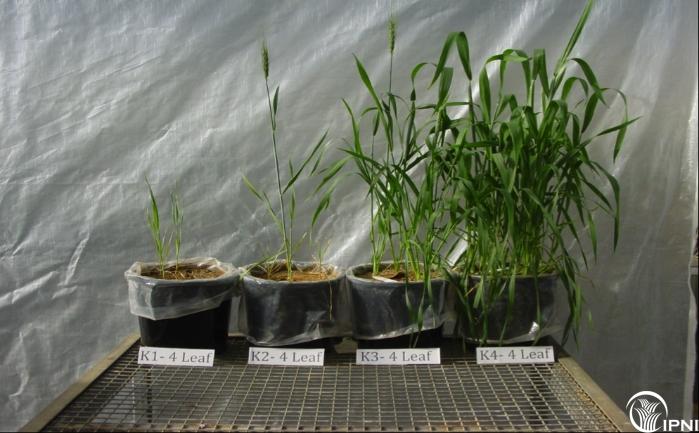
Photo 3. The effect of K fertiliser (K1- K4) on vegetative growth applied at 4th leaf stage
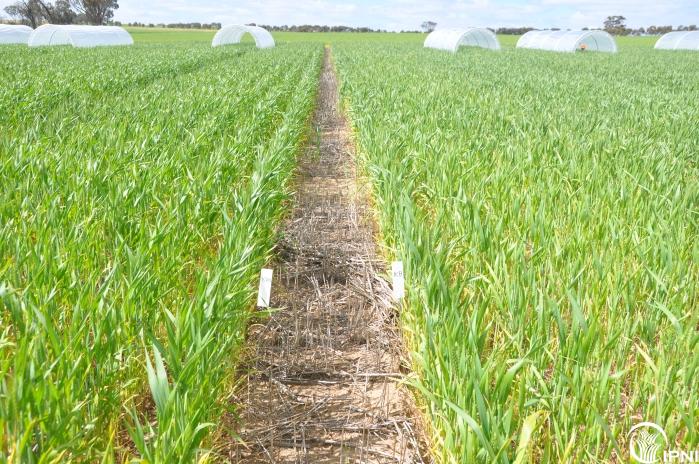
FIELD EXPERIMENT
Wheat (cv. Calingiri) was grown on a yellow-brown sandy earth where the K had never been applied. The Colwell soil extractable K was 37 mg/kg, a soil test level expected to be deficient for the wheat growth and yield.
Several levels of K (0, 20, 40 & 80 kg K/ha), as sulphate of potash and as muriate of potash [2 K sources], were applied from deficient to an adequate supply of K for grain yield. The K was applied at 3 times (5, 10 & 15 weeks after seeding) through the season. The timing of the first K application was delayed until 5 weeks, to allowed plants to grow and develop a root system. This was to limit any possible leaching of K below the rooting profile in the time of crop establishment. This is a common method of K application particularly in the high rainfall zone (>500 mm annual average rainfall) of WA.
Plots were 1.5 m wide and 20 m long, with a 0.4 m untreated area between each plot. Six rows of seed, 22.5 cm apart, were sown down each plot. Wheat seed was sown at 75 kg/ha ~2 cm deep, the standard recommendation in Western Australia (WA). The following basal fertilizers were applied to ensure K was the only nutrient element limiting wheat production:
1. Placed (drilled) with seed while sowing, 15 kg P/ha as triple superphosphate (20% P, 16% Ca, <1% S), 1.5 kg Cu/ha as copper sulfate (25% Cu), 1.6 kg Zn/ha as zinc oxide (80% Zn) and 98 g Mo/ha as sodium molybdate (39% Mo).
2. Applied to the soil surface by hand 4-6 weeks after sowing, 20 kg S/ha as gypsum (17% S) and 90 kg N/ha as urea (46%N).
Weeds, leaf diseases and insects (mainly aphids) were controlled using appropriate chemical sprays.
Measurements
Site for the experiment was selected in late-March of the year the experiment started when soil samples from the sites were collected to 30 cm depth at 10 random locations. The samples were separated into the following profile depths: 0-10, 10-20, and 20-30 cm. The samples from each profile depth at each site were bulked and subsamples of the air-dry bulked samples were used to measure Colwell soil extractable K.
Grain yields were measured by machine harvesting grain from each whole plot, excluding the two outside rows, and the harvested grain was weighed.
Field results
Only grain production data are presented because results for shoots and grain were similar and grain production is economically more important. Grain yield responses to applied K occurred [about 1.2 t/ha yield increase] and were larger when the first two levels of K were applied (See Figures 3). Maximum yield s were reached where ~40 kg K/ha was applied, particularly at 5 and 10 WAS. The 10 WAS K application gave higher yields compared to 5 and 15 WAS. The K applied 15WAS gave slightly lower grain yield. The shape of the response curve is different for the muriate and sulphate (see Fig 3b & Fig 3c). There is little chance that this is due to the S content of sulphate of potash as an S basal fertiliser was applied. Also, soil extractable S was 12 mg/kg in the surface 0-10 cm of soil and increased down the profile to 22 mg S/kg; levels usually associated with adequate soil test levels of S for wheat production (Anderson et. al. 2013). Plant tissue analyses indicated adequate concentrations for all plant essential nutrients (see below), except K.
Shoot nutrient concentrations
The concentration of essential nutrients except N in plant shoots at boot stage (Z59) of wheat showed that all nutrients were adequately supplied for maximum grain yield. The concentrations (average, maximum, minimum, adequate) for the macronutrients found across all experiments of both series were (%): P (0.47, 0.56, 0.40, 0.3), N (3.3, 3.6, 3.1, 3), S (0.28, 0.39, 0.22, 0.2), Ca (0.28, 0.39, 0.22, 0.2), and Mg (0.21, 0.34, 0.19, 0.12). Similarly, the concentrations (average, maximum, minimum, adequate) for the micronutrients found across all experiments of both series were (mg kg-1); Cu (6, 6.8, 5.3, 5), Zn (28, 40, 19, 14), MN (90, 155, 38, 35), Fe (200, 360, 86, 50) and B (7.8, 12, 6.3, 6). All plant shoot concentrations of plant essential nutrients were above adequate shoot concentrations as outlined by Reuter & Robinson (1997).
Figure 3. The effect of K application at 5, 10 and 15 weeks through the growing season on the grain yield of wheat [t/ha]. The diamond is the first application of K at 5 weeks after seeding (WAS) followed by the square applied at 10 WAS, and then the triangle K applied at 15 WAS. The closed symbols are muriate of potash; open symbols are sulphate of potash.
There was no significant difference between the 2 K sources (Fig 3). About 1.5 -2 times more K needed to be applied at 5 weeks compared to the 10-week application (Fig 3). This may indicate losses of K fertiliser from the root zone by early leaching rain. K at 15 WAS did not allow for full crop recovery for maximum yield [~10% lower yield] and about 2 -2.5 times more K fertiliser was required.
K fertiliser use efficiency
The K applied at 10 WAS was more efficient for crop production possibly due to K losses via leaching, and the late K at 15 WAS was too late for full crop recovery (Table 2).
Table 2. The K fertiliser use efficiencyA for the grain produced (kg/Kg K applied) of the 2 K sources applied to wheat at 5, 10 and 15 WAS.
20 | 40 | 80 | |
| Muriate@ 5weeks | 39.26 | 29.35 | 16.53 |
| Muriate@ 10weeks | 50.74 | 32.59 | 20.33 |
| Muriate@ 15weeks | 30 | 26.11 | 15.83 |
| Sulfate @ 5weeks | 42.59 | 29.35 | 13.89 |
| Sulfate @ 10weeks | 50.93 | 33.75 | 15.51 |
| Sulfate @ 15weeks | 40.37 | 23.89 | 13.43 |
- AK Use efficiency = (GyKapplied – GyKo)/Kapplied
Potential future work
- · Lime x K interaction
· Foliar K at flowering for lo/marginal soil K
References
- Anderson et al 2013. Soil sulphur-crop response calibration relationships and criteria for field crops grown in Australia. Crop & pasture Science 64, 523-530.
Response to K timing, wheat
K fertilizer applied at different times
Effect of K rates applied at 4 leaf stage
K trial in Western Australia